
ExplainSpeaking-Economy is a weekly newsletter by Udit Misra, delivered in your inbox every Monday morning. Click here to subscribe
Dear Readers,
The Election Commission has announced the polling schedule for elections to five state Assemblies, namely Uttar Pradesh, Uttarakhand, Punjab, Goa and Manipur. As such, this is a good time to look at how these states performed on different economic parameters such as people’s income, unemployment, health etc.
A few months ago, ExplainSpeaking had written about per capita incomes in these states. The analysis was based on the latest RBI data. The detailed analysis can be read by clicking on this link but here are two charts that summarise the findings.
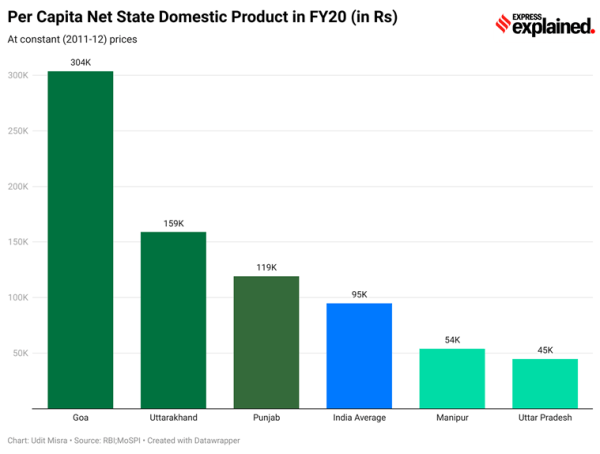 The Chart maps the per capita net state domestic product for each of the five states going to the polls.
Chart 1 mapped the per capita net state domestic product for each of the five states and set it against the national average. As can be seen, even though UP’s overall economy is bigger than almost all the states in India, in per capita terms, it is pretty weak. The reverse is true for Goa.
But from the perspective of voters, the more important question is: How did per capita incomes grow in the past 5 years?
![]() This chart shows the per capita income growth in the five states.
This chart shows the per capita income growth in the five states.
Chart 2 attempts to answer that question. For each state, this chart provides three data points. One, shown in the blue-coloured bar, is the rate at which incomes grew in the five years between FY13 and FY17. Two, the red-coloured bar shows the rate at which per capita incomes grew before Covid. Lastly, the orange-coloured bar attempts to show how incomes would grow in the past five years — FY18 to FY22. The orange bar calculations are based on the rather optimistic assumption that per capita incomes will recover fully in FY22.
This is unlikely to happen now that we have the First Advance Estimates of the GDP of the whole country for FY22. The latest official data shows that while overall GDP is likely to claw back to the pre-Covid level, per capita incomes and spending will remain substantially below pre-Covid levels.
Chart 2 shows that when it comes to raising the per capita incomes of its residents, barring Uttarakhand, which barely manages to cross the national average, all other election-bound states have performed much below the national average. Goa is the worst performer with per capita incomes expected to be lower than five years ago.
Today, we will look at the state of unemployment in these states. For data, we will depend on the latest estimates from the Centre for Monitoring Indian Economy. But since CMIE does not provide data for Manipur, this analysis will focus on just four states.
How Do We Measure Unemployment?
Before taking up each state’s data, here is a brief introduction on how to read it.
Typically, unemployment is tracked by looking at the Unemployment Rate (or UER henceforth). The UER is the percentage of people in the labour force who demanded work but did not get it.
Under normal circumstances, the UER is a perfectly fine metric to track unemployment but in India’s case, and especially over the past decade, UER is becoming ineffective in accurately assessing the true level of unemployment distress. That’s because the labour force itself has been shrinking rapidly.
The labour force includes those who are employed and those who are looking for work but unable to get it (i.e. unemployed).
So, what has been happening over the past decade is that the Labour Force Participation Rate in India has been falling. As such, often when it appears that UER has fallen, it is not because more jobs have been created but because fewer people have demanded jobs (in other words, the LFPR has fallen).
In most other comparable countries, the LFPR is between 60% to 70%. In India, it has been hovering around 40%. What this means is that in other countries 60% of people belonging to the working-age group (i.e. 15 years and above) demand a job while in India only 40% look for a job.
The 20 percentage point differential — that too at the scale of India’s population — represents a huge number (millions) of people who do not have any jobs. But since millions do not formally “demand” work, there is an undercounting of unemployed people in India. This is why UER fails to adequately capture the unemployment distress in India.
It is for this reason that Mahesh Vyas, the CEO of CMIE, advocates using “Employment Rate” (or ER henceforth) to correctly understand what is happening to joblessness in India.
The Employment Rate is the percentage of people of the working-age group who have a job. By definition, it takes into account the movement in LFPR. You can read about this in more detail and understand how Indian policymakers have been misreading the unemployment distress by clicking on this piece.
Five Key Variables
For each of the states, we have five key variables. These are:
- Total Working Age Population (i.e. more than 15 years of age); (in thousands)
- Total Employed (above 15 years of age); (in thousands)
- Employment Rate (Total Employed as a % of working-age population)
- Labour Force Participation Rate (Labour Force as a % of working-age population)
- Unemployment Rate (Unemployed as a % of the labour force)
When you are reading the tables, you will notice that often enough, the UER falls not because more people are getting employment (#2 above) but because fewer people are demanding work (#4 above).
To truly understand the distress, look at what is happening to ER (#3 above).
The data has been compiled for the five years between December 2016 to December 2021.
Let’s start alphabetically:
![]() Unemployment rate in Goa.
Unemployment rate in Goa.
Goa (see Table)
The state has been witnessing a high unemployment rate but the UER alone does not capture the depth of distress because the LFPR itself has fallen sharply. The first three columns better capture the joblessness.
In percentage terms, Goa has had the most spectacular collapse in the Employment Rate. It was 49.31% in December 2016 but it has now fallen to under 32%. In other words, five years ago every second person in Goa’s working-age population had a job but now that proportion has fallen to one in three.
The absolute numbers show the exact extent of distress. In the past five years, while Goa’s working-age population has grown from 12.29 lakh to 13.13 lakh, the total number of people with jobs has fallen from 6.06 lakh to 4.20 lakh.
Oddly enough, the sharpest fall in the ER happened in the Jan-Apr 2019 period, just on the eve of the national general elections of 2019.
![]() Unemployment rate in Punjab.
Unemployment rate in Punjab.
Punjab (see Table)
Punjab, too, employs fewer people today than it did five years ago. In December 2016, when its total working-age population was 2.33 crore, more than 98.37 lakh of them had a job. In December 2021, when its working-age population has grown to 2.58 crore, it has just 95.16 lakh employed.
While all states in this analysis fall below the national average both in ER and LFPR, Punjab is not only closest to the national average but also has seen the smallest decline in ER over the past 5 years.
![]() Unemployment rate in Uttar Pradesh.
Unemployment rate in Uttar Pradesh.
Uttar Pradesh (see Table)
UP is a good example of why UER is misleading policymakers from correctly diagnosing the scale of unemployment.
On the face of it, UP’s unemployment rate is 4.83 — much lower than Punjab and Goa. Yet UER hides the fall in LFPR.
A look at the first three columns presents the true picture.
In December 2016, UP had 5.76 crore employed people. At that time its total working-age population was 14.95 crore. Its ER was already quite low compared to the other states and the national average (43% at that time).
In the five years, its ER has fallen further to below 33%.
As a result, even though UP’s total working-age population has increased by over 2 crore over the past five years, the total number of people with jobs has shrunk by over 16 lakh.
![]() Unemployment rate in Uttarakhand.
Unemployment rate in Uttarakhand.
Uttarakhand (see Table)
The state has the lowest UER in all the four states analysed here. But again, much like UP, its low UER hides the true distress because it has the lowest LFPR and lowest Employment Rate of all four states.
In the five years, its working-age population has grown by around 11.5 lakh but the total number of people with jobs has come down by around 4.5 lakh.
Summary
In all four states, the Employment Rate has fallen substantially over the past five years. That means, even though working-age populations have increased by lakhs — and crores in UP’s case — the number of people with jobs has, instead of going up, actually come down.
For instance, if UP had maintained its Employment Rate from December 2016 (which was already quite low) then the total number of employed in the state in December 2021 would have been 6.57 crore instead of 5.59 crore. In other words, if UP had the same percentage of people employed (as a proportion of the working-age population) in December 2021 as it had in December 2016 then almost 1 crore UP residents belonging to the working-age group would have had a job today.
Lastly, while all these states were below the national average, the fact is India as a whole has seen its LFPR and Employment Rate fall sharply. Between December 2016 and December 2021, India’s LFPR has fallen from 46% to 40%, and the Employment Rate has fallen from 43% to 37%.
As a result, while India’s total working-age population has grown from 96 crore to 108 crore, the total number of employed has gone down from 41.2 crore to 40.4 crore.
Share your views and queries at udit.misra@expressindia.com
Stay masked and stay safe.
Udit
Credit: Source link


