ExplainSpeaking-Economy is a weekly newsletter by Udit Misra, delivered in your inbox every Monday morning. Click here to subscribe
Dear Readers,
Five state Assembly elections kick off this week. Voters will look at a whole host of factors before casting their vote. At ExplainSpeaking, we have been analysing different economic trends.
We have looked at how per capita incomes grew in the five poll-bound states.
Next, we looked at overall employment levels and found that in four of the five states for which data was available — Uttar Pradesh, Punjab, Goa, and Uttarakhand — the total number of employed people at the end of December 2021 was lower than five years ago.
Then we looked at another key election issue — inflation — and an associated one — wage rate. We found that in the run-up to these elections all the states have witnessed inflation rates that are higher than the national average, especially food price inflation.
Today, we will drill down further on the issue of employment or the lack of it. We will look at employment levels among the youth (those between 15 to 29 years of age), highly educated (graduation and above), and women. [But we will not be able to consider Manipur since data is not available].
Why look at these categories in particular?
There are several reasons.
In India, the overall unemployment rate is quite unevenly distributed. In other words, unemployment
– is highest among the youth,
– rises with educational attainment,
– and is higher among women.
Here are three Charts (sourced from the Centre for Monitoring Indian Economy) that buttress these assertions.
Chart 1 (CMIE, December 2021) underscores the youth unemployment challenge. The blue line shows the Labour Force Participation Rate (LFPR). The LFPR is the percentage of the working-age population (that is, those above 15 years of age) who are actively looking for jobs. As such, it includes both the total employed people and those who are unemployed. The red line is the Unemployment Rate, which is expressed as a percentage of the Labour Force.
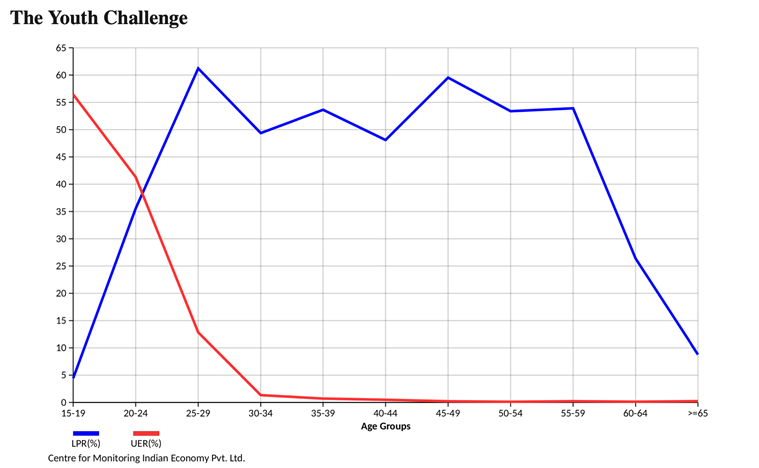
Chart 1 shows us that the Unemployment Rate (UER) is highest among the youth (15 to 29 years) even when the LFPR in this age bracket is relatively lower than other age brackets. In other words, even when a relatively lower percentage of people belonging to the youth age bracket (15 to 29 years) look for (or, “demand”) work, the economy is unable to create (or “supply”) enough jobs.
Chart 1 captures one big reason why so many young people are out on the streets, angrily demanding answers from the government.
Chart 2 (CMIE, December 2021) captures the other big reason behind youth unrest. In India, unemployment levels rise with education. CMIE calls it the “Skilling Challenge” because evidently the skills picked up by the youth as they study are grossly mismatched with those needed in the job market. As of December 2021, one in five graduates in India who were looking for a job were unemployed. This does not mean that those graduates who are employed might be doing what they like or getting paid what they desire. This number also does not include the millions who drop out of the labour force when they get disillusioned (and stop looking for a job).
![]()
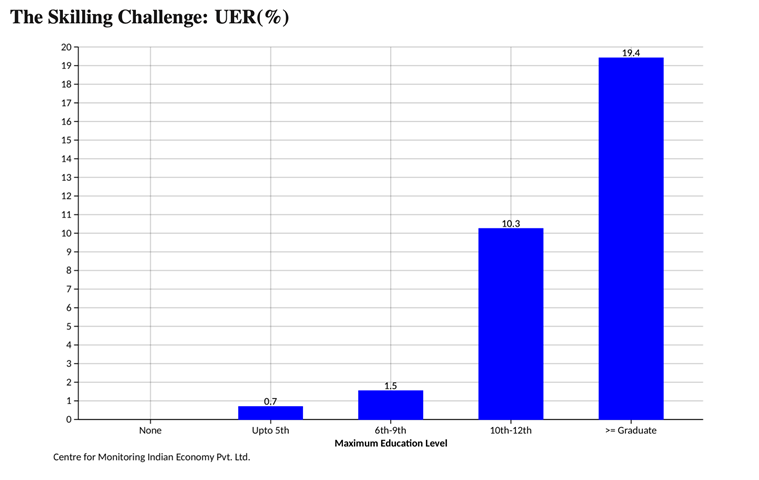
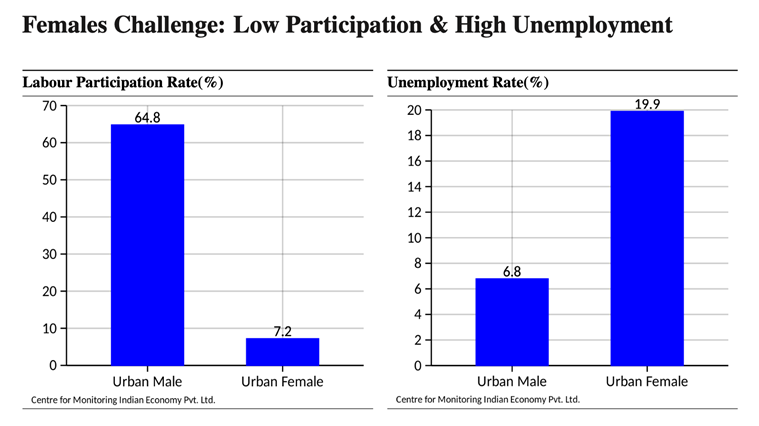
Chart 3 and Chart 4 (both December 2021) highlight the gender aspect of unemployment in India.
![]()
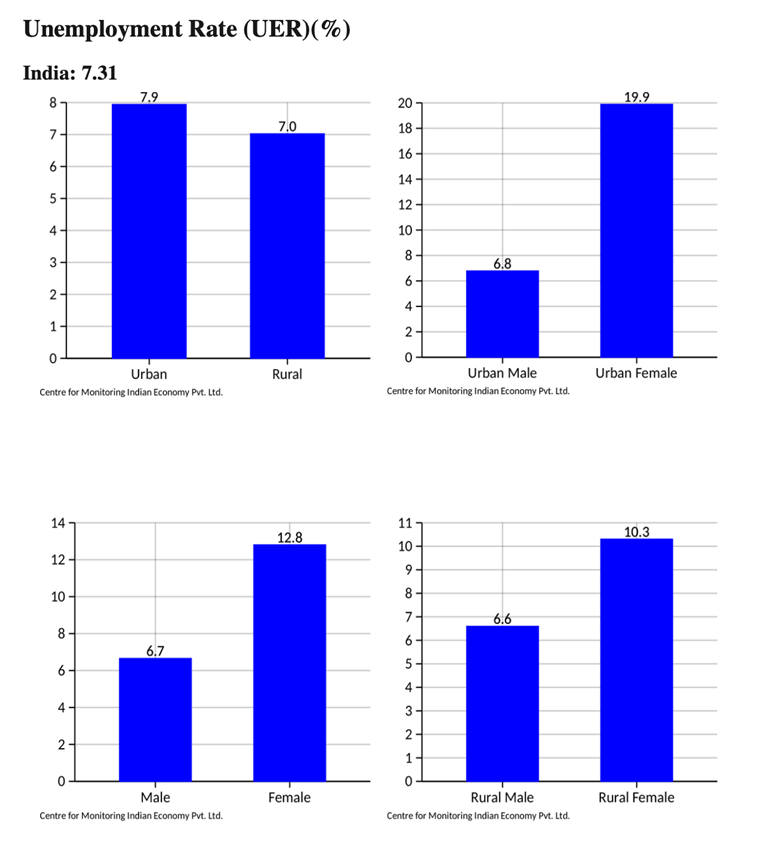
Chart 3 shows that no matter which way you slice the data, unemployment among women is considerably higher than in men. Chart 4 brings out an even scarier aspect of female unemployment. Unemployment among women (for instance, urban women in this case) is higher even though a very small percentage (just 7.2%) of women are actually looking for (or demanding) a job.
![]()
In the recently released Global Risks Report, the World Economic Forum, famous for the annual get-together at Davos, pointed out “Widespread youth disillusionment” as one of the main risks for India.
By “widespread youth disillusionment”, WEF refers to “youth disengagement, lack of confidence and/or loss of trust of existing economic, political and social structures at a global scale, negatively impacting social stability, individual well-being and economic productivity.”
The noisy scenes of young people demanding jobs in UP, the most populous state in India, are a good pointer that unemployment may well be a key deciding factor for voters especially the young, the educated and the women.
So where do the poll-bound states stand on each of these metrics?
ExplainSpeaking analysed publicly available CMIE data to arrive at the following results. The tables below look at the total population belonging to the concerned category and the total number among those who have a job. The ratio is calculated as the Employment Rate (i.e. total employed expressed as a percentage of the total population in that category) to help us compare the state with each other as well as the national average.
The data is compiled for three time periods:
> Sept-Dec 2016 (as it provides the picture just before the start of the Assembly term)
> Sept-Dec 2019 (as it provides a comparable picture before the Covid pandemic)
> Sept-Dec 2021 (as it is the latest available data and provides a clear 5 years of trend)
Uttar Pradesh (See CHART 5)
![]()
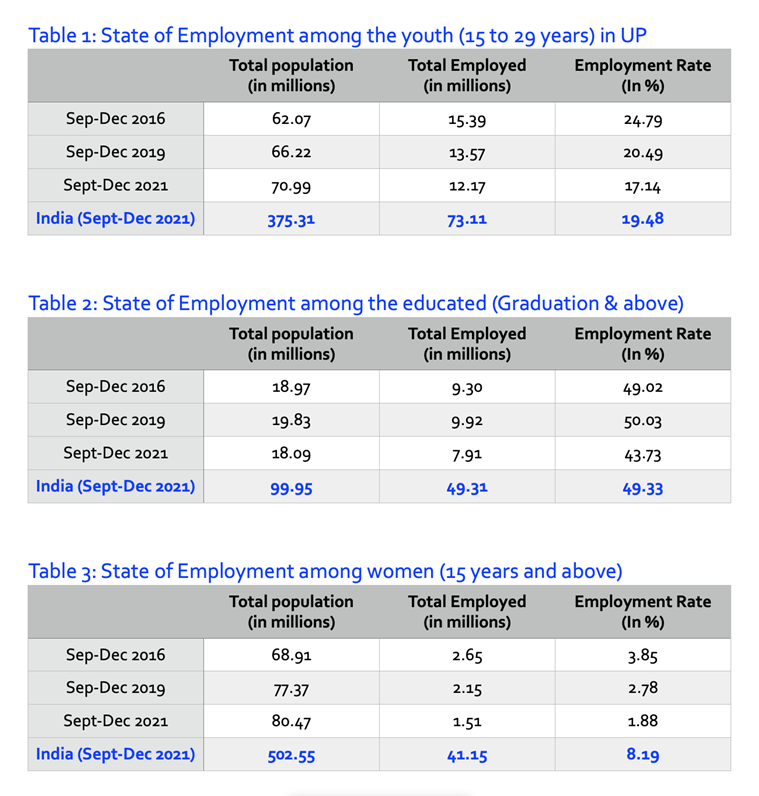
On all three counts — employment for youth, for educated and for women — not only is Uttar Pradesh far behind the national average but it has also seen a sharp decline over the past five years.
For instance, in December 2016, 15.39 million youth had a job. Five years later, even though the total youth population had swelled by 9 million (or 90 lakh), the total employed had shrunk by over 3 million (or 30 lakh).
This should put in perspective the claims of job creation by the ruling government. It also shows that UP’s youth have been suffering the worst fate because the state failed to create new jobs.
The employment rate among graduates (and above) moved up marginally between 2016 and 2019 but since then it has fallen sharply.
As far as women are concerned, UP was always a terrible laggard. In the past five years, this situation has become even worse. While the population of working-age women went up by 12 million, the number of women with a job halved from the already paltry number of December 2016. Less than 2% of all women belonging to the working-age population (15 years and above) have a job.
Punjab (See CHART 6)
![]()
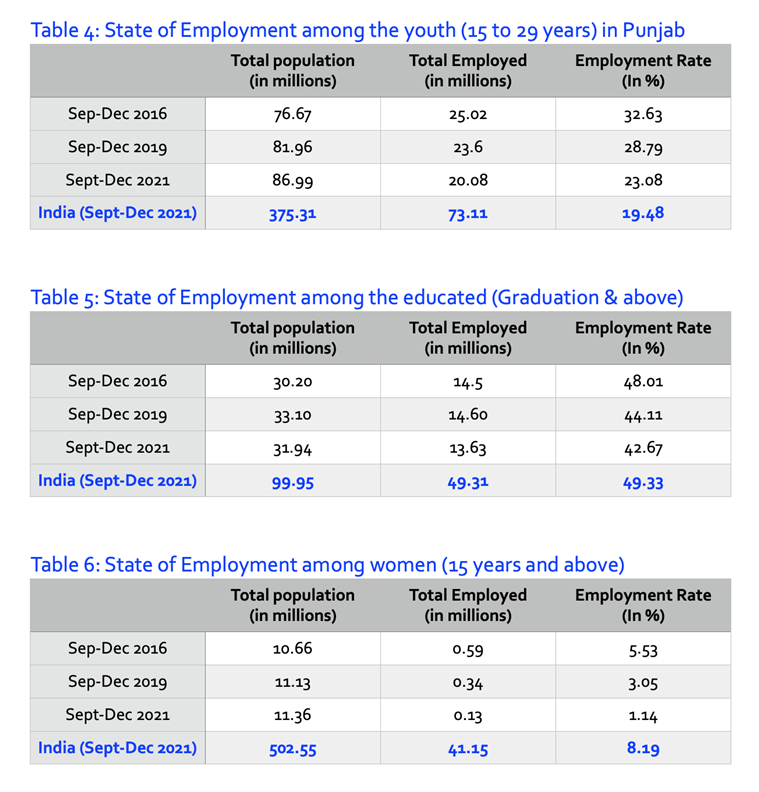
Youth employment rates in Punjab are much better than the national average but the fact remains that they have been coming down over the past five years. While the total youth population has gone up by 10 million, the number with jobs has come down by 5 million.
Similarly, the employment rates both among graduates (and above), as well as women, have fallen sharply.
Goa (See CHART 7)
![]()
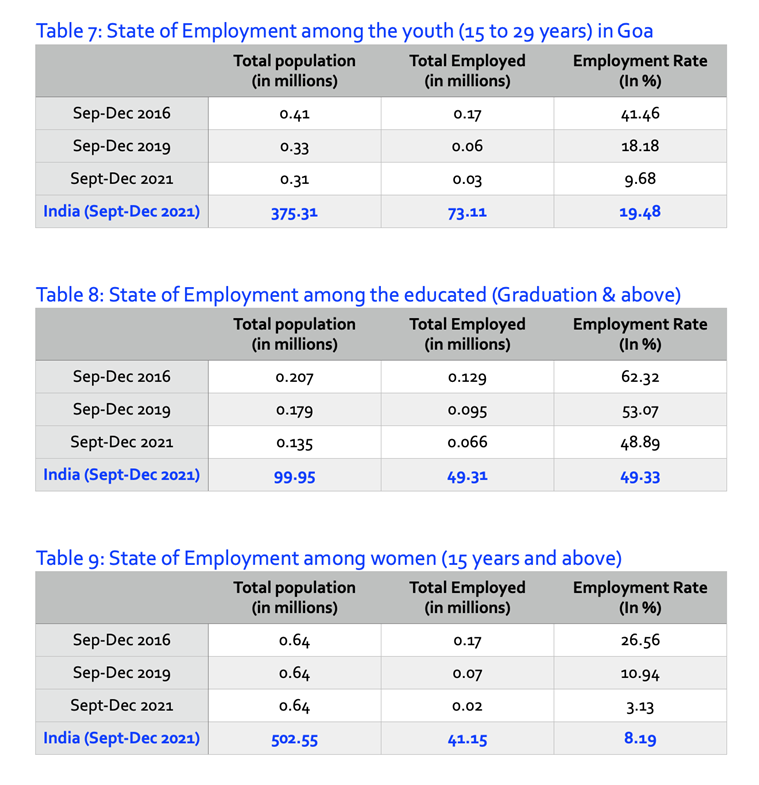
Past analysis of RBI data has shown that Goa is one state where per capita incomes have contracted (instead of growing) over the past year. As such, it is hardly surprising to find a rather precipitous decline in youth employment rate.
In December 2016 the youth population was 4.05 lakh. Of these, 1.71 lakh had a job. But over the past years, even though the youth population has shrunk by a lakh, the number of young people with a job has completely shrunk. According to CMIE, only about 30,000 belonging to this age bracket have a job today.
The situation is much better if one looks at graduates and (better) educated people. But this employment rate too has been declining over the past five years and is now below the national average.
The percentage of working-age women with jobs, too, has plummeted in Goa.
Uttarakhand (See CHART 8)
![]()
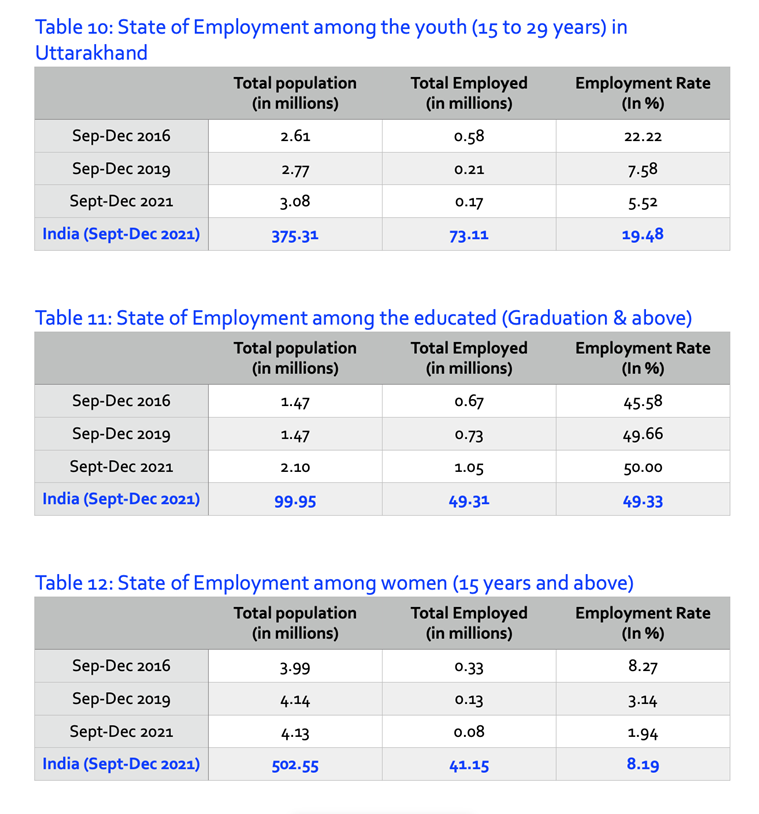
This is yet another state where youth employment has taken a massive hit. The employment rate among youth, which was already quite low, has become one-fourth over the past five years.
However, the employment rate among the highly educated has increased, and, in this regard, Uttarakhand is an outlier.
But employment for women again follows the broader trend of a collapse.
That’s that on unemployment.
But before closing out this issue, there are a few more pointers.
The Union Budget for 2022-23 was presented last week. If you have been a regular reader of ExplainSpeaking you would have found yourself ahead of the curve in understanding the Budget. For instance, a week before the Budget, ExplainSpeaking had explained how a Budget strategy based on investment-led growth may pan out in the future.
If you are joining today, here’s the gist of the Budget.
The central thrust of the latest Budget is not that the government will spend more to boost the economy. Far from it.
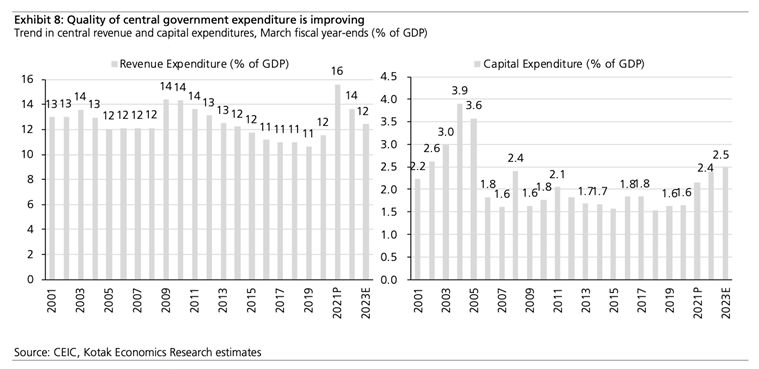
The main thrust of the Budget lies in the expenditure switching from “revenue” to “capital”. In other words, the government is going to spend a smaller percentage of its total expenditure towards daily consumption needs and a higher percentage of it on building capital assets. In 2019-20, capital expenditure was just 11% of the government’s total expenditure but it went up in FY21 and FY22, and it is budgeted to be 18% in FY23.
What is the salience of this expenditure switching? Simply put, this type of expenditure switching was the central goal of the Fiscal Responsibility and Budget Management Act, 2003 (FRBM Act). Such switching is seen as an improvement in the quality of government expenditure (see Chart 9).
![]()
For a more detailed understanding, please watch this episode of the newly launched video series — called The Express Economist — where Prof N R Bhanumurthy (VC, Dr B R Ambedkar School of Economics in Bangalore) explains (in very simple language) the difference between revenue and capital expenditure and how they impact the economy differently.
Another issue that was conspicuous by its absence in the Union Budget was any reference to farmers’ distress. Here is another episode of The Express Economist in which Prof Himanshu of JNU explains the origins of Indian farmers’ woes and why farmers will not be doubling their income (which was supposed to happen in 2022) any time soon.
Lastly, the Reserve Bank of India will come out with its latest monetary policy review this week. In all likelihood, the RBI will raise the reverse repo rate. Here’s a piece that explains what reverse repo is and how raising it will impact the economy.
Stay safe and stay masked.
Udit
Credit: Source link


 Bill")
