
1. About this release
This publication presents information on Stamp Taxes, which are those collected for ‘Land and property’ Stamp Duty Land Tax (SDLT),’Stocks and shares and other liable securities’, Stamp Duty Reserve Tax and Stamp Duty (SDRT and SD). SDLT data is split by transaction type, property type, region, price band and buyer type, including transactions paying the higher rates on additional dwellings (HRAD), and those claiming the first-time buyers’ relief (FTBR).
This publication relates to the 2020 to 2021 financial year and will be affected by the COVID-19 restrictions that were introduced on 23 March 2020.
In the Summer Economic Update the Chancellor announced a temporary increase to the nil rate band for SDLT to £500,000 from 8 July 2020 to 31st March 2021 for residential properties (this will be referred to as the ‘SDLT holiday’ in this publication), this will be covered by the statistics in this publication.
The introduction of the 2% surcharge for Non-Residents Stamp Duty Land Tax (NRSDLT) that was introduced on 1st April 2021 will not be covered by this publication. Although there may be some forestalling that will have increased transaction numbers in March 2021 as a result of this new surcharge.
2. Changes to the publication
This publication contains new data for 2020 to 2021. It also includes a new experimental analysis of the purchaser’s age for first time buyers.
3. Main Points
- Total stamp taxes receipts have fallen between 2019 to 2020 and 2020 to 2021, decreasing by 19% from £15,220 million to £12,345 million.
- Land and property stamp taxes (SDLT) receipts decreased by 25% from £11,600 million to £8,670 million between 2019 to 2020 and 2020 to 2021. This fall is due to a combination of COVID-19 restrictions and the introduction of the SDLT holiday in July 2020.
- Stamp taxes on shares and other liable securities (SDRT and SD) receipts have risen slightly (by 2%) from £3,620 million to £3,675 million between 2019 to 2020 and 2020 to 2021.
- Residential SDLT receipts have fallen by 29% between 2019 to 2020 and 2020 to 2021, from £8,420 million to £6,010 million.
- Non-residential receipts decreased by 16% between 2019 to 2020 and 2020 to 2021, from £3,180 million to £2,660 million.
- SDLT receipts in England have mirrored the fall in total receipts between 2019 to 2020 and 2020 to 2021, decreasing by 25% from £11,520 million to £8,610 million.
- SDLT receipts in Northern Ireland have also shown a large fall from £80 million to £60 million between 2019 to 2020 and 2020 to 2021.
- London was the area with the highest amount of SDLT receipts in 2020 to 2021, £3,455 million or 40% of total SDLT receipts. This was slightly higher (up 2%) than in 2019 to 2020.
- Properties valued at £250,000 or less accounted for 51% of all transactions (8% lower than 2019 to 2020). These properties accounted for 11% of total SDLT receipts (the same as 2019 to 2020). Properties valued at over £1 million accounted for 3% of all transactions (no change from 2019 to 2020). These properties accounted for 57% of total SDLT receipts (12% higher than in 2019 to 2020).
- There were 237,200 transactions that were eligible to pay the higher rates on additional dwellings (HRAD), which was 6,900 (3%) higher than in 2019 to 2020. HRAD receipts were £3,370 million in 2020 to 2021 which is £450 million (12%) lower than in 2019 to 2020.
- 113,500 transactions benefited from first time buyers’ relief (FTBR) in 2020 to 2021, with an estimated £362 million relieved in total. This has fallen markedly over the last year from 222,700 transactions and £541 million relieved. The main reason for this large fall is the introduction of the SDLT holiday where there is no benefit in people claiming the relief. As from July 2020 no tax is payable on the first £500,000 of the purchase price of residential property.
4. Stamp taxes receipts, 2019 to 2020 to 2020 to 2021
- Total stamp taxes receipts decreased by 19% from £15,220 million to £12,345 million between 2019 to 2020 and 2020 to 2021.
- Land and property stamp taxes (SDLT) receipts decreased by 25% from £11,600 million to £8,670 million between 2019 to 2020 and 2020 to 2021, This has been caused by COVID-19 restrictions and the introduction of the SDLT holiday in July 2020.
- Property, excluding leases receipts decreased by 24% from £10,530 million to £8,055 million.
- Leases receipts decreased by 43% from £1,070 million to £610 million.
- Stamp taxes on shares and other liable securities (SDRT and SD) receipts have risen slightly by 2% from £3,620 million to £3,675 million between 2019 to 2020 and 2020 to 2021.
- Stamp Duty Reserve Tax (SDRT) receipts increased by 14% from £2,670 million to £3,050 million.
- Stamp Duty (SD) receipts decreased by 34% from £950 million to £625 million.
5. Stamp Duty Land Tax (SDLT) transactions and receipts by property type
Residential
- Residential SDLT receipts decreased by 29% from £8,420 million to £6,010 million between 2019 to 2020 and 2020 to 2021.
- Residential transactions have remained broadly the same from 1,023,000 to 1,025,000 between 2019 to 2020 and 2020 to 2021.
Non-Residential
- Non-residential receipts decreased by 16% from £3,180 million to £2,660 million between 2019 to 2020 and 2020 to 2021.
- Non-residential transactions have also decreased by 16% from 107,000 to 90,000 between 2019 to 2020 and 2020 to 2021.
6.
SDLT receipts and transactions by region
Receipts
- 99.3% (£8,610 million) of SDLT receipts in 2020 to 2021 came from transactions in England, which was the same percentage as in 2019 to 2020.
- Northern Ireland accounted for 0.7% (£60 million) in receipts in 2020 to 2021.
- London accounted for the majority of SDLT receipts in 2020 to 2021, £3,455 million or 40% of total SDLT receipts. This was 2% higher than in 2019 to 2020.
- SDLT receipts in England have mirrored the fall in total receipts between 2019 to 2020 and 2020 to 2021, decreasing by 25% from £11,520 million to £8,610 million.
- The steepest percentage fall was in the West Midlands, by 32%, from £605 million to £410 million.
- All regions had a fall in receipts of at least 21%.
- Residential receipts in 2020 to 2021 have fallen in every region compared to 2019 to 2020: ranging from a 21% fall in London to a 43% fall in the West Midlands.
- Non-residential receipts in 2020 to 2021 have also fallen in each region compared to 2019 to 2020. However, the fall has been much lower ranging from a 2% fall in the East Midlands to a 25% fall in London.
Chart 1 below shows a breakdown of the percentage change in receipts by region between 2019 to 2020 and 2020 to 2021 by property type.
This chart shows that receipts have fallen in every region for both residential and non-residential transactions when comparing 2020 to 2021 receipts to those in 2019 to 2020.
Chart 1 below shows a breakdown of the percentage change in receipts by region between 2019-20 and 2020-21 by property type
Transactions
- Total transactions have remained broadly similar (a 1% fall) at 1,129,000 in 2019 to 2020 and 1,115,000 in 2020 to 2021,
- Residential transaction numbers have remained broadly similar at 1,023,000 in 2019 to 2020 and 1,025,000 in 2020 to 2021.
- Non-residential transaction numbers have reduced by 27,000 (16%) from 107,000 in 2019 to 2020 to 90,000 in 2020 to 2021.
Chart 2 below shows a breakdown of the percentage change in transactions by region between 2019 to 2020 and 2020 to 2021 for both residential and non-residential transactions.
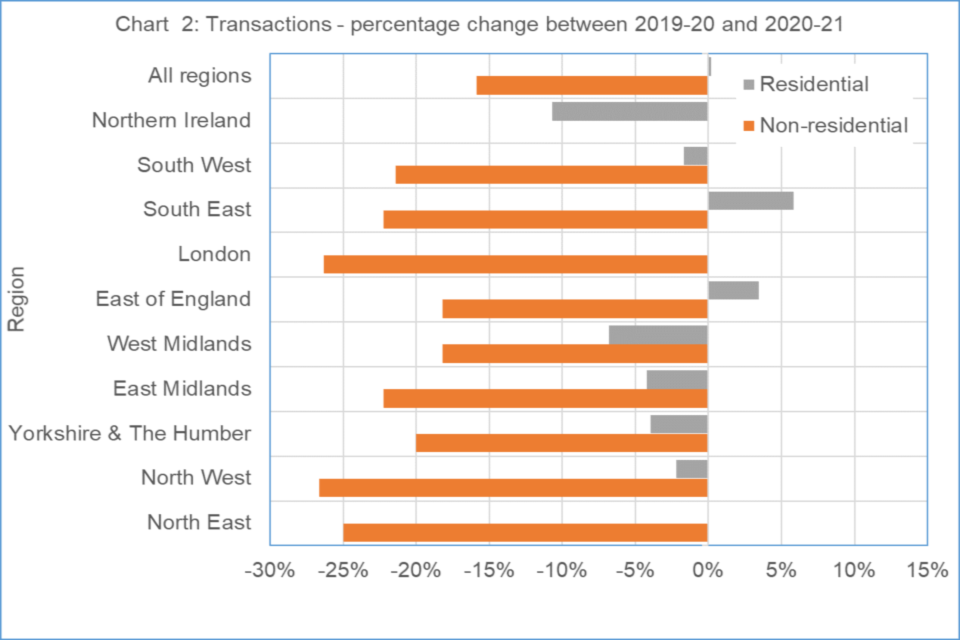
Chart 2 below shows a breakdown of the percentage change in transactions by region between 2019-20 and 2020-21 for both residential and non-residential transactions.
This chart shows falls in non-residential transactions across all regions except for Northern Ireland which has not changed. Whilst, residential transactions have a varied pattern with falls in Northern Ireland, Yorkshire and West Midlands and increases in the South East and the East of England. All other areas have less than a 3% change from 2019 to 2020.
7.
SDLT receipts by local authority and parliamentary constituency
- The local government areas with the highest SDLT receipts are mostly in London. With Buckinghamshire and Elmbridge being the only areas not in London in the top 10 areas for residential receipts Whilst, Manchester, Buckinghamshire and Milton Keynes are in the top 10 areas for non-residential receipts.
- Note that local authority and parliamentary constituency areas may have the same name but may not be the same due to having different boundaries.
- The local government area of Westminster had the highest SDLT receipts from residential transactions (£425 million), representing 7.1% of all residential SDLT receipts.
- The UK parliamentary constituency with the largest receipts for residential SDLT was Cities of London and Westminster (£285 million) representing 4.7% of residential SDLT receipts.
- The local government area of Westminster had the highest SDLT receipts from non-residential transactions (£200 million), representing 7.5% of all non-residential SDLT receipts.
- The UK parliamentary constituency with the largest receipts for non-residential SDLT was Cities of London and Westminster (£210 million) representing 7.9% of non-residential SDLT receipts.
8. Stamp Duty Land Tax (SDLT) transactions and receipts by price band
- The distribution of residential and non-residential property transactions and receipts has been affected by COVID-19 restrictions and the SDLT holiday.
- Total SDLT transactions, where the value of the property was £250,000 or less, accounted for 51% of transactions (down by 8% since 2019 to 2020), but 11% of total SDLT receipts in 2020 to 2021 (no change from 2019 to 2020).
- Properties over £1 million accounted for 3% of transactions (no change from 2019 to 2020) and 57% of total SDLT receipts in 2020 to 2021 (up 12% compared to 2019 to 2020).
- Residential properties, where the value is less than £250,000, accounted for 9% of residential property receipts and 50% of residential transactions in 2020 to 2021.
- Non-residential properties, where the value is above £1 million, accounted for 77% of non-residential property receipts but only 11% of non- residential transactions in 2020 to 2021.
9.
SDLT transactions and receipts by buyer type
- The majority of residential properties are bought by individuals (91%), which is similar to 2019 to 2020.
- The propensity for non-individuals (e.g. public sector bodies, charities etc.) to purchase residential properties increases with price, just over 19% of residential properties over £2 million were purchased by this type of buyer in 2020 to 2021. This is 5% lower than in 2019 to 2020.
- The amount of SDLT from non-natural persons (companies, partnerships and collective investment schemes) paying the 15% rate of SDLT on residential transactions has reduced (56%) from £80 million in 2019 to 2020 to £35 million in 2020 to 2021.
- The majority (73%) of non-residential transactions were made by non-individuals in 2020 to 2021. This is broadly the same as 2019 to 2020 (1% fall).
- Non-individuals accounted for 93% of non-residential transactions over £2 million in 2020 to 2021. This is broadly the same as 2019 to 2020 (1% fall).
10. Age by Price profile of residential purchasers – New Experimental Statistics
We are continuing to publish experimental statistics relating to age of individuals purchasing residential properties. The intention is to expand on age related statistics at a more granular level in future Official Statistic publications, subject to demand, quality and resources.
- 40% of all residential purchasers were aged between 25 and 39 in 2020 to 2021. This is broadly the same as 2019 to 2020. Within that:
- 13% were aged between 25 and 29 (a 1% fall from 2019 to 2020),
- 15% were aged between 30 and 34 the same as in 2019 to 2020, and
- 12% were aged between 35 and 39 (a 1% fall from 2019 to 2020).
- The remaining 60% has a very similar distribution by all age bands to 2019 to 2020.
- For the lowest price band, where the value is less than £250,000, this has the highest peak in the 25 to 29 age band in 2020 to 2021, with 73,700 transactions.
- Proceeding through the other price bands in 2020 to 2021, it can be seen that the respective peak age rises as the price band does (as it did in 2019 to 2020); the £250,001 to £500,000 band peaks in the 30 to 34 age range with 58,100 transactions, the £500,001 to £1,000,000 band peaks in the 35 to 39 range with 18,300. Whilst for transactions over £1 million the peak age lies in the 40 to 44 age band.
Chart 3 below shows the percentages of individual residential purchasers by age band in both 2019 to 2020 and 2020 to 2021. The figures shown only represents the first purchaser that appears on the SDLT return for these years.
The distribution by age band shown in this chart shows that there is very little difference between the age of purchasers in both 2019 to 2020 and 2020 to 2021.
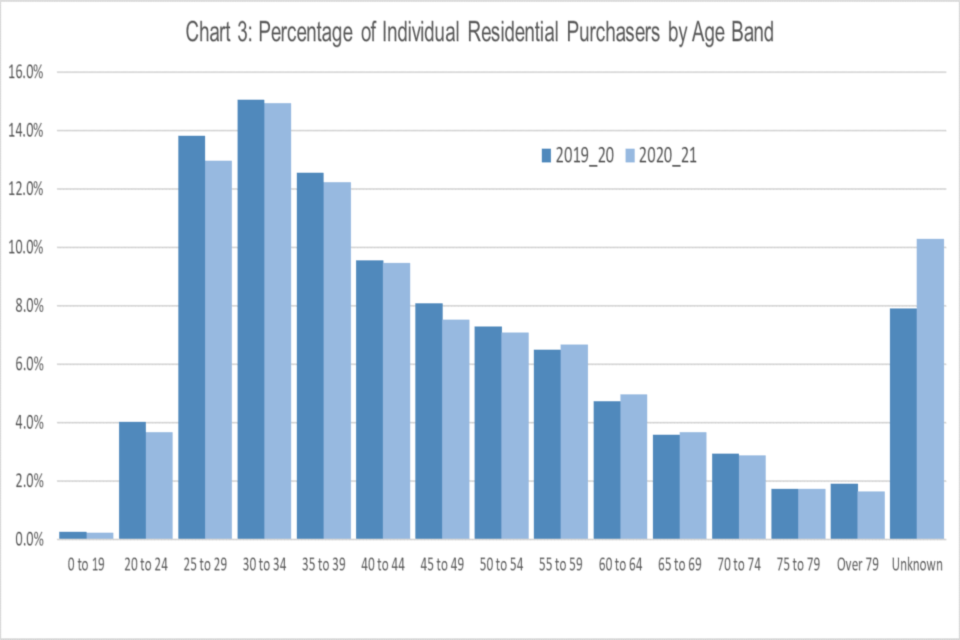
Chart 3 below shows the percentages of individual residential purchasers by age band in both 2019-20 and 2020-21. The figures shown only represents the first purchaser that appears on the SDLT return for these years.
We have introduced some new experimental analysis for the age of purchasers claiming first-time buyers’ relief. This clearly shows that in 2020 to 2021, the majority (34%) of claims are being made by purchasers aged between 25 and 29 years old. The next highest age group is those aged 30 to 34 years old (23%). There is very little difference between the age of purchasers claiming first-time buyer’s relief in both 2019 to 2020 and 2020 to 2021. This information can be found in Table 6d of the accompanying spreadsheet.
11. Higher Rates on Additional Dwellings (HRAD) transactions and receipts
- There were 237,200 additional dwellings transactions in 2020 to 2021. This is slightly higher (6.900 or 3%) than for 2019 to 2020.
- Higher rates on additional dwellings (HRAD) receipts were £3,370 million in 2020 to 2021 which is £450 million (12%) lower than in 2019 to 2020. Of this total, £1,405 million came from the additional 3% element, which is 14% lower than in 2019 to 2020.
- Additional dwellings transactions accounted for 23% (up by 1% since 2019 to 2020) of residential transactions and 56% (an 11% rise since 2019 to 2020) of residential receipts in 2020 to 2021.
- Additional dwellings follow a slightly different distribution to main rate residential transactions, with higher proportions below £250,000 and above £3 million. This may be a reflection of different types of property investors investing at the lower and higher ends of the market. Also, the SDLT holiday that was introduced in 2020 to 2021 may have also impacted on this.
- The figures cited above include transactions involving company purchasers that are not subject to or are relieved from the higher 15% taxation rate.
12. Higher Rates on Additional Dwellings (HRAD) transactions and receipts by price band
- 4% of additional dwellings transactions were valued above £1 million in 2020 to 2021, accounting for 44% of HRAD receipts, and 25% of the 3% surcharge total receipts.
- 56% of additional dwellings transactions were valued below £250,000 in 2020 to 2021 (5% lower than in 2019 to 2020), accounting for 26% of residential SDLT transactions (up 2% from 2019 to 2020) and 87% of residential receipts within this price band (up by 16% on 2019 to 2020).
- The proportion of additional dwelling transactions increased in the North East and the South West by 9%. There were also increases in London and the South East of 6% and a 4% increase in the East of England. All the other areas remained unchanged except for the West Midlands and Northern Ireland which had falls of 4% and 14% respectively.
- The proportion of HRAD receipts fell by at least 11% in all regions apart from the North East, South East and South West which had decreases of 9%, 8% and 4% respectively.
- The local government areas of Westminster and Kensington & Chelsea shared the highest HRAD 3% SDLT receipts from residential transactions (£55 million) or 3.9%.
- The UK parliamentary constituency with the largest receipts for residential HRAD 3% SDLT was Cities of London and Westminster (£40 million) or 2.8%.
- The region with the highest proportion of transactions which were additional dwellings was London, with 29%. The South East had the lowest proportion at 19%. This followed a similar pattern to 2019 to 2020. Northern Ireland had the highest proportion of residential receipts from HRAD transactions, at 83% (an increase from 60% in 2019 to 2020).
13. First time buyers’ relief (FTBR) transactions
- The total amount of SDLT relieved due to FTBR in 2020 to 2021 was estimated at £362 million. This is much lower than the figure of £541 million in 2019 to 2020 as the introduction of the SDLT Holiday in July 2020 meant that it was no longer necessary to claim this relief. This is because no SDLT was payable on the first £500,000 of the purchase price for residential properties.
- London and the South East accounted for £175 million in 2020 to 2021, which is 48% of the total and the same as in 2019 to 2020.
- 113,500 transactions benefited from first time buyers’ relief in 2020 to 2021. This is a decrease of 49% from the 2019 to 2020 figure of 222,700.
- The average amount relieved per transaction was £3,200. London had the highest average relief at £6,800 and Northern Ireland had the lowest at £1,000. This reflects the different regional house prices.
Chart 4 below shows the percentage of cases claiming first-time buyers’ relief by region for both 2019 to 2020 and 2020 to 2021
This chart shows that there is a large change between the percentages of transactions claiming first-time buyers’ relief between 2019 to 2020 and 2020 to 2021.
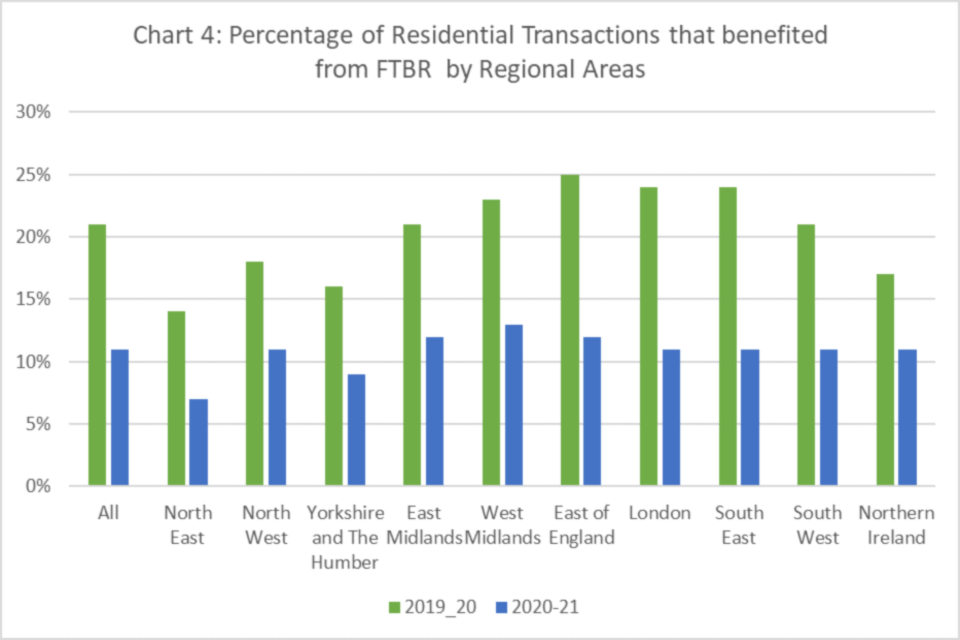
Chart 4 below shows the percentage of cases claiming first-time buyers’ relief by region for both 2019-20 and 2020-21
14. Background information – recent changes in stamp taxes
Changes in Stamp Duty Land Tax
Over the past few years, there have been a number of major tax policy reforms affecting SDLT receipts. The structure of residential SDLT was subject to major reform in December 2014, therefore the figure for 2014-15 includes tax collected under both the new and old systems. Prior to 4 December 2014, varying flat rates of SDLT were charged on the total consideration (price). Since then, SDLT for residential property is charged at different rates depending on the portion of the purchase price that falls within each rate band. The reforms mean that less SDLT was paid on the majority of residential transactions, with only those at higher prices paying more. A similar change was introduced for non-residential transactions in April 2016.
The increase in receipts in 2016-17 is associated with the introduction of the higher rates of SDLT charged on additional residential properties. This reform added 3 percentage points to the SDLT rate for purchasers who already own residential property.
First time buyers’ relief (FTBR) was introduced in November 2017, which means that first time buyers buying properties valued less than £300,000 pay no SDLT and those buying properties valued between £300,000 and £500,000 pay £5,000 less than standard rates.
In April 2015, SDLT in Scotland was devolved to the Scottish Government and is now known as Land and Buildings Transactions Tax. Figures for SDLT from 2015-16 onwards do not include any receipts from Scotland and are therefore not directly comparable with previous years. The fall in SDLT receipts in 2015-16 compared with 2014-15 is due to both the absence of receipts from Scotland and the fact that 2015-16 was the first full financial year of the new SDLT regime.
SDLT was devolved to Wales in April 2018, so this publication no longer includes Welsh transactions that were completed from Q2 2018 onwards. However, a small number of Welsh transactions were filed after April 2018, thus they are reflected in transactions and receipts in the post-devolution period. The Welsh Revenue Authority publishes its own statistics on its new Land Transactions Tax which has replaced SDLT.
On 8th July 2020, the SDLT holiday was introduced. This raised the nil rate band for SDLT to £500,000 for the purchase of residential properties. This continued until 30th June 2021. After which time the nil-rate band reduced to the first £250,000 of the purchase price from 1st July to 30th September 2021 after which the tax-free band will revert to the first £125,000 of the purchase price.
On 1st April 2021 a 2% Non-Resident Stamp Duty Land Tax surcharge was introduced for non-residents who purchase residential property.
Changes in ‘Other (Stamp Duty)’
Stamp Duty receipts rarely follow the same trend as SDRT. The increases in ‘Other (Stamp Duty)’ between 2015-16 and 2016-17 were in large part due to legislative changes for transfer schemes of arrangement and the resulting tax status. More information can be found under the following link for legislative changes for transfer schemes of arrangements.
Contact information
E-mail stamptaxes.statistics@hmrc.gov.uk
Website https://www.gov.uk/government/collections/stamp-duties-statistics
Contacts
Credit: Source link


